
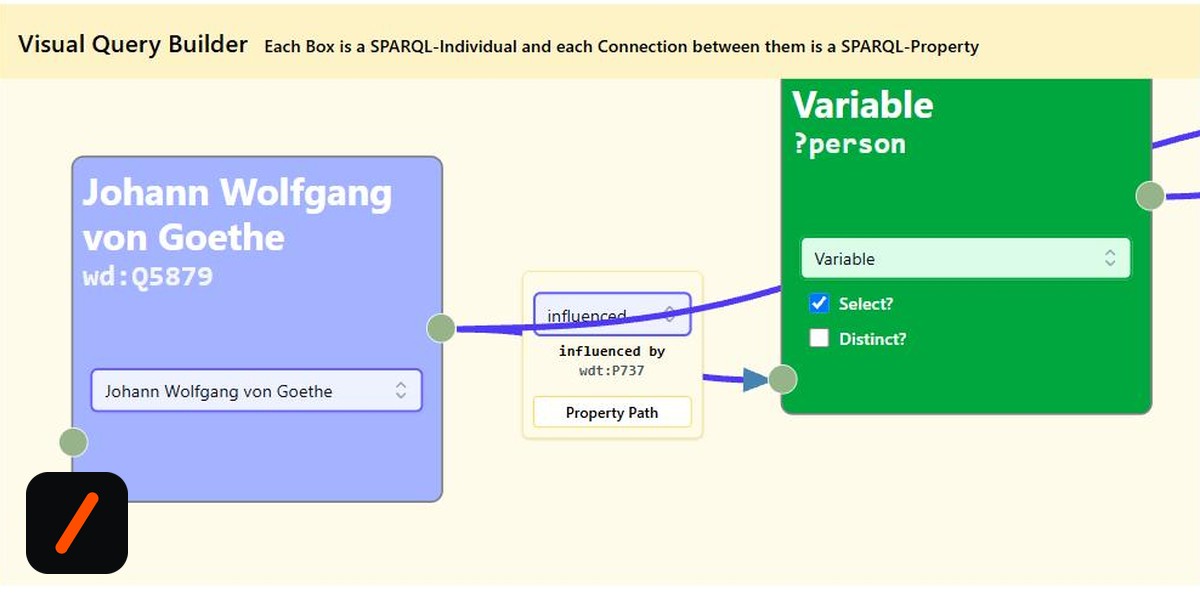
Query by Graph is a free web app that lets you query a knowledge graph such as Wikidata or FactGrid by drawing boxes and arrows instead of writing SPARQL, the database language those systems use. Daniel Motz built it as a bachelor thesis at Friedrich Schiller University Jena, and its standout trick is that it works in both directions: draw a graph and you get a correct SPARQL query, or paste a query and it draws the graph for you.
- Each box is an item or a variable, and each arrow is a property such as "educated at" or "influenced by"; the app writes the matching SPARQL live.
- The conversion engine is written in Rust and compiled to WebAssembly, so everything runs in the browser with no backend.
- It targets Wikibase instances and ships preset for Wikidata, FactGrid (a database for historians) and MiMoText.
- A preliminary test with digital humanities students found they could use it with minimal training.
What does Query by Graph do?
"Query by Graph lets you build SPARQL queries for Wikibase instances like FactGrid by drawing a graph, without writing a single line of code," Daniel told us. On the canvas, every box is an entity, either a real item such as Johann Wolfgang von Goethe (wd:Q5879) or a variable such as ?person, and every arrow between them is a property picked from the database, for example "influenced by" (wdt:P737) or "educated at" (wdt:P69). As you draw, a panel below shows the generated SPARQL, complete with the prefixes it needs, a label service so results come back with readable names, and a comment on each line naming the relationship in plain words.
RelatedThis Student Built a Media Server That Never Touches Your Data Plan
When we tried it, we pasted a short query asking which people who influenced Goethe studied at the same university he did. The app redrew it on the canvas as a Goethe box linked by an "influenced by" arrow to a ?person variable, then rewrote the query in its own tidy form with comments. It is the fastest way we have seen to understand what an unfamiliar SPARQL query is actually asking.
Why build a visual query tool for knowledge graphs?
"I think knowledge graphs are a great way to organize complex data, but the challenge is to make them accessible for a wider audience," Daniel said. The thesis explains the audience. Knowledge graphs, called triplestores, became popular in the digital humanities because their data model is so flexible, and FactGrid runs one specifically for historians so their research data can be published and queried. But querying it means writing SPARQL and knowing the database's conventions, which puts a programming task in the hands of people trained in history, not computer science. The project was inspired by a blog post from FactGrid's Olaf Simons, who sketched the idea of querying the database with drawings.
Wikibase, the software behind both Wikidata and FactGrid, adds an extra wrinkle. Facts often carry qualifiers, such as the start date of Goethe's studies at Leipzig, and in raw triples those are stored through an intermediate statement node that is confusing to query by hand. Daniel's thesis introduces a new labelled hyper-edge in the visual graph so a qualified fact still looks like one arrow with extra detail attached, and the tool expands it into the correct triples behind the scenes.
What was the hardest part?
"The hardest part was making the translation bidirectional," Daniel said. "You can draw a graph and get SPARQL, but you can also write a SPARQL query and see it visualized." Generating a query from a drawing is the easier half, because the drawing only allows structures the tool understands. Going the other way means accepting whatever a user types, parsing real SPARQL, and deciding how to lay it out as boxes and arrows, including property paths such as sequences, alternatives and the *, + and ? repetition modifiers, which the graph format supports.
That is why the core is written in Rust. The app's README gives the reasons directly: the conversion algorithm should be reusable, fast and provably correct, and the Rust compiler helps with all three. The library uses the spargebra crate to parse SPARQL, exposes two functions to the browser through WebAssembly, one for each direction, and has its own test suites for query logic, property paths and resilience against bad input.
| Trait | Query by Graph | Writing SPARQL by hand |
|---|---|---|
| What you need to know | The items and relations you care about | SPARQL syntax, prefixes and IDs |
| Qualifiers | One labelled edge | Reified statement nodes |
| Reading someone else's query | Paste it and see it drawn | Read it line by line |
| Where it runs | Entirely in the browser | Any editor |
How is it built?
The front end is Vue 3 with TypeScript and Tailwind, with the Rete.js node editor for the canvas and the Monaco editor, the engine behind VS Code, for the query panel. In September 2026 Daniel added the Qlue-ls SPARQL language server to that editor, which brings semantic highlighting and formatting to the generated query. There is no backend at all: entity search calls the Wikibase API of whichever data source you pick, and preset sources cover Wikidata, FactGrid and the MiMoText project at the University of Trier.
RelatedThis Student Built a One-Click Pi-hole Remote for Your Browser
The repository started in July 2024, the thesis was submitted in Jena in January 2025, and the project has kept moving since, with around 414 commits and fresh work landing in September 2026. The thesis itself is open about its limits: the preliminary test with digital humanities students was small and ran before qualifier support existed, so a full user study is still needed. It also sets out the next step, deriving drag-and-drop query fragments from ontologies, borrowing from the Sparnatural project while avoiding its requirement of an ontology for every single query.
- Jul 2024Repository created first visual-to-SPARQL prototype
- Jan 2025Bachelor thesis submitted Friedrich Schiller University Jena
- Sep 2026Qlue-ls language server semantic highlighting in the query editor
- NextOntology-driven fragments and a full user study
Our take
Visual query builders for SPARQL are not new, and the thesis names the competition honestly. What makes Query by Graph worth featuring is the round trip. A tool that only goes from drawing to query is a teaching aid; one that also turns any query into an editable drawing becomes a way for historians and researchers to read, share and adjust queries written by someone more technical. Building that on a tested Rust core, running entirely in the browser and still maintained long after the thesis was graded, is the kind of engineering discipline most thesis projects never get to.
Query by Graph was built by Daniel Motz at Friedrich Schiller University Jena. Try it or read the thesis: live app · GitHub · daniel-motz.de.
- Built something? Doesn't need to be finished or fancy: a side project, a hackathon build, or a class project you're proud of counts.
- Email hello@genztech.blog with what you built, why you built it, a link, and your name plus college.
- See every spotlight so far at genztech.blog/campus-radar.
- InterviewDaniel Motz email answers to GenZTech, September 2026
- OfficialHerrMotz/Query-by-Graph README, VQG language spec, Rust core and tests
- PaperQuery by Graph, bachelor thesis Friedrich Schiller University Jena, January 2025
- ReferenceFactGrid the Wikibase database for historians that inspired the project
Reporting based on a direct interview with Daniel Motz, the public repository and the published thesis. Hero image is a screenshot of the live app taken by GenZTech.